----------
The correlated samples:
| class 1 | K+==>3 Π | Field Up |
| class 2 | K+==>3 Π | Field Down |
| class 3 | K-==>3 Π | Field Up |
| class 4 | K-==>3 Π | Field Down |
have been produced and reconstructed with the following procedure:
First
A K+ event is simulated in the NA48 standard apparatus with a positive field (up). Then, starting from the smeared hits into the chambers, the analysis performs the track and the full event kinematic reconstruction.
Second
The same event, just before any reconstruction, is reflected respect to the yz (vertical) plane. The charged pions appear now to have opposite curvatures, as induced by a negative magnetic field , and if reconstructed with reversed field (down) the event will be seen still as a K+ .
Third
The above event is now reflected respect to the xz (horizontal) plane; the pion curvatures remain as before, but the K now passes through the other acromat tax hole as usually does a K- particle. Therefore the event is reconstructed as K- with a field reset to up. Note that this strategy in the event generation clearly mantains the correlation between the K-momentum and K-position introduced by the beam optics.
Fourth
The event is again reflected respect to the vertical plane, and it is reconstructed as K- with magnetic field down (see step 2).
The above procedure generates four classes of events which are identically distributed in the u-variable indipendently on the magnetic field orientation, but according to the NA48 apparatus symmetry.
Really the left-right and up-down symmetries in the NA48 apparatus are softly broken by the presence of:
a) the acromat that forces the K+ and the K- on different paths
b) the focusing-defocusing sequence that appears different for K+ or a K-.
However the mentioned procedure is still perfect with respect to the achromat system, which benefits of a left-right symmetry and up-down symmetry time a charge conjugation.
Fortunately the effect (b) is so small and it has been neglected in this study.
To fix the ideas let us define the following operator:
Py parity operator that reflect the event respect to the vertical plane xz
Px parity operator that reflect the event respect to the horizontal plane yz
R180= PxPy rotation of 180o; aroud z axes
C charge conjuction operator
Definig now |K+up> the first sample of events, the four classes are interrelated by the following matrix:
Now only some general plots...
just to see the Flyo production at work.
Resolution and chi2
Shift in x
Obviously the analysis of the "impertubated" categories yields an exact zero δg.
However a small perturbation changing the hit point coordinates in one chamber of the above perfectly correlated events, could produce a slope different from zero which can be easily interpreted because the correlation procedure described above is virtually statistical error free.
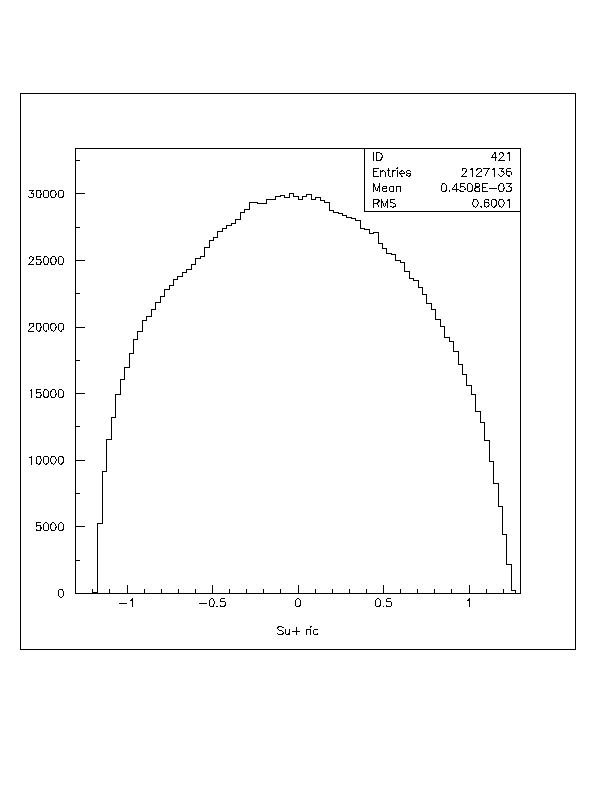
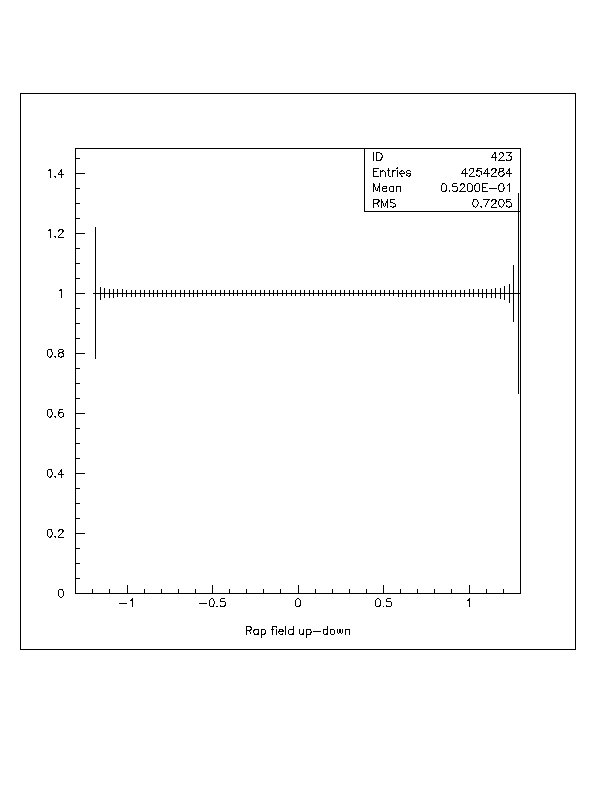
The following plots show the u-distribution as obtained after a 1 mm displacement of DCH2 along the x direction. The two samples with opposite magnetic field orientation are plotted separately (first two plots) and then merged (third plot).
u distributions for up and down field.
The ratio between the u distributions could be done in two different ways.
First case:
Here each u+/u- distribution belongs to runs with the same magnetic field orientation:
The plots show up a clear slope artificially induced by
the DCH2 displacement δgup=(+0.106 ± 0.003) in the first
plot and δgdown=(-0.106 ± 0.003) in the second for the
reversed magnetic field.
This effect can be understood by taking into account that a shift in the x direction, modifies the apparent curvature of the pion track and therefore increases or decreases the pion momentum in a charge dependent fashion. Let's also note that the two samples entering in each plot are related by the CR180=CPxPy operator that reflect all the curvature orientation respect to a vertical plane.
Now the u value, which is computed from the odd pion energy in the center of mass, is affected by opposite distortion depending on the primary Kaon charge.
It has been also verified that a shift of -1.0 mm gives exactly the same effects on the slopes, but with the opposite signs. Moreover, reducing the shift to 0.5 mm it has been obtained (in a small run) a slope of δg=(0.05 ± 0.006), that demonstrates that the effect , at least in the first approximation, is linear with the shift.
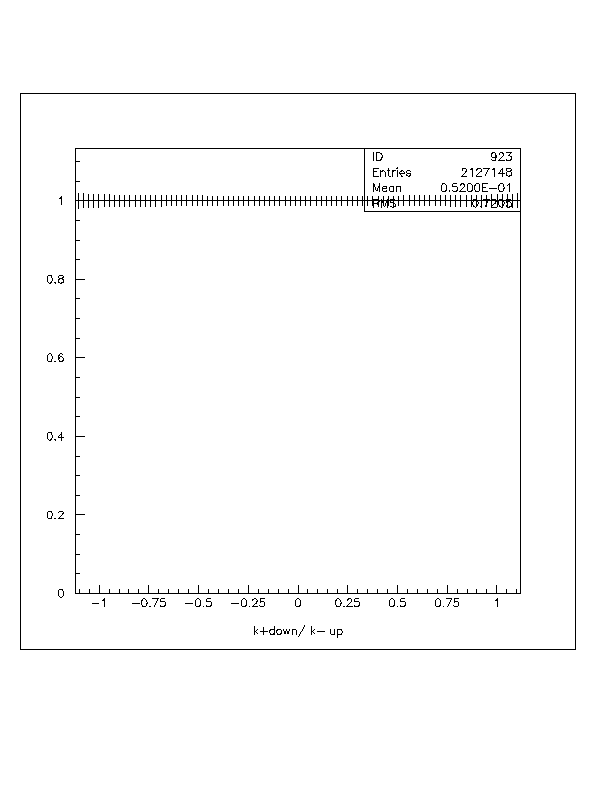
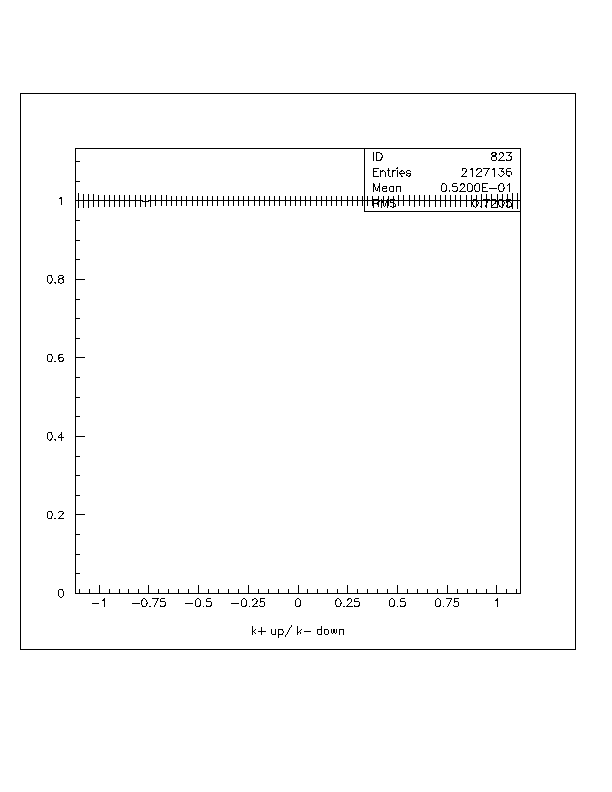
Second case:
The other method is to couple the u+ and u- distribution with opposite (crossed) field signs
This result shows that the two "crossed ratio" are NOT AT ALL sensitive
to
geometrical mis-alignment and therefore it indicates a better procedure
to estimate the slope:
First you get the two slopes by fitting the "crossed u+/u- distributions", then you compute the final slope just as a simple average.
A K+ event is simulated in the NA48 standard apparatus with a positive field (up). Then, starting from the smeared hits into the chambers, the analysis performs the track and the full event kinematic reconstruction.
Second
The same event, just before any reconstruction, is reflected respect to the yz (vertical) plane. The charged pions appear now to have opposite curvatures, as induced by a negative magnetic field , and if reconstructed with reversed field (down) the event will be seen still as a K+ .
Third
The above event is now reflected respect to the xz (horizontal) plane; the pion curvatures remain as before, but the K now passes through the other acromat tax hole as usually does a K- particle. Therefore the event is reconstructed as K- with a field reset to up. Note that this strategy in the event generation clearly mantains the correlation between the K-momentum and K-position introduced by the beam optics.
Fourth
The event is again reflected respect to the vertical plane, and it is reconstructed as K- with magnetic field down (see step 2).
The above procedure generates four classes of events which are identically distributed in the u-variable indipendently on the magnetic field orientation, but according to the NA48 apparatus symmetry.
Really the left-right and up-down symmetries in the NA48 apparatus are softly broken by the presence of:
a) the acromat that forces the K+ and the K- on different paths
b) the focusing-defocusing sequence that appears different for K+ or a K-.
However the mentioned procedure is still perfect with respect to the achromat system, which benefits of a left-right symmetry and up-down symmetry time a charge conjugation.
Fortunately the effect (b) is so small and it has been neglected in this study.
To fix the ideas let us define the following operator:
Py parity operator that reflect the event respect to the vertical plane xz
Px parity operator that reflect the event respect to the horizontal plane yz
R180= PxPy rotation of 180o; aroud z axes
C charge conjuction operator
Definig now |K+up> the first sample of events, the four classes are interrelated by the following matrix:
|
class |
K+up |
K+dw |
K-up |
K-dw |
|
K+up |
I |
Py |
CR180 |
CPx |
|
K+dw |
Py |
I |
CPx |
CR180 |
|
K-up |
CR180 |
CPx |
I |
Py |
|
K-dw |
CPx |
CR180 |
Py |
I |
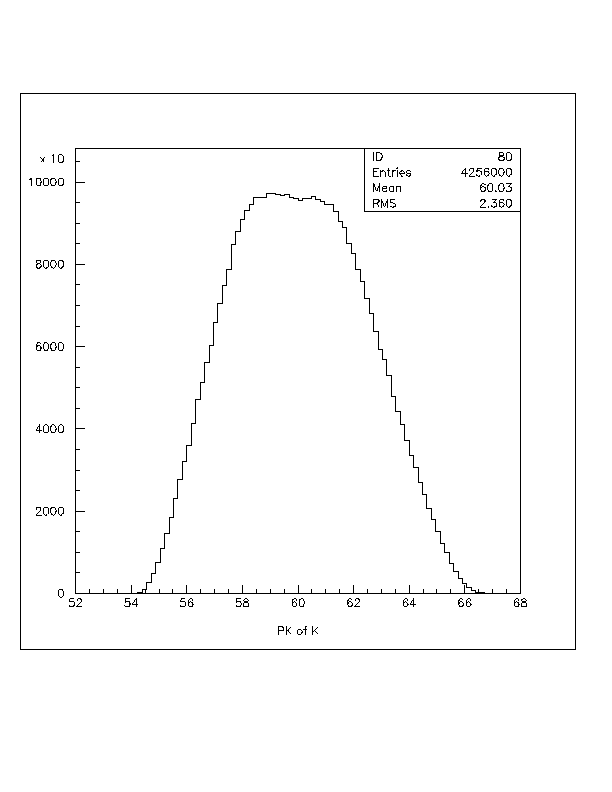
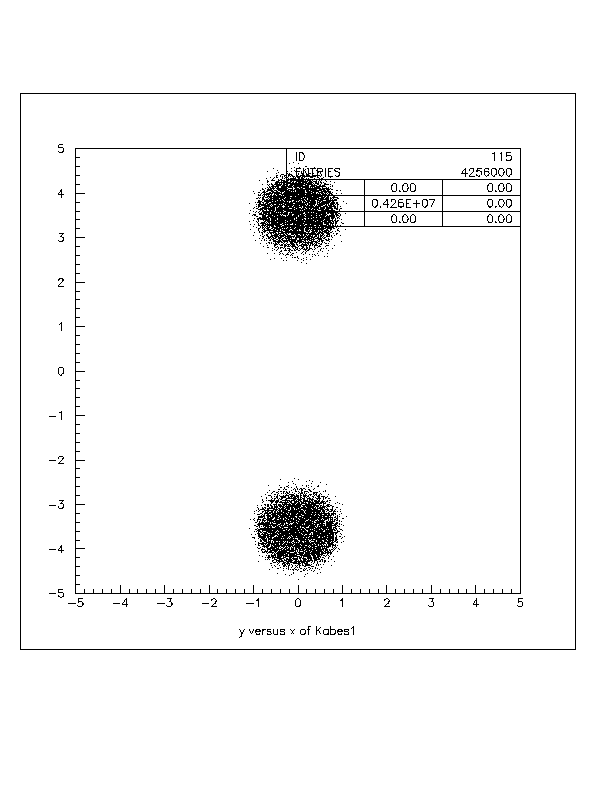
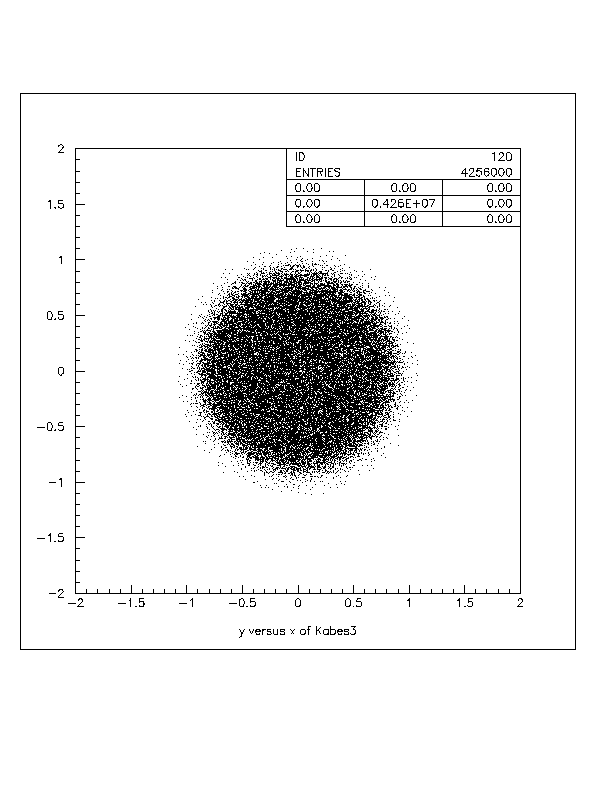
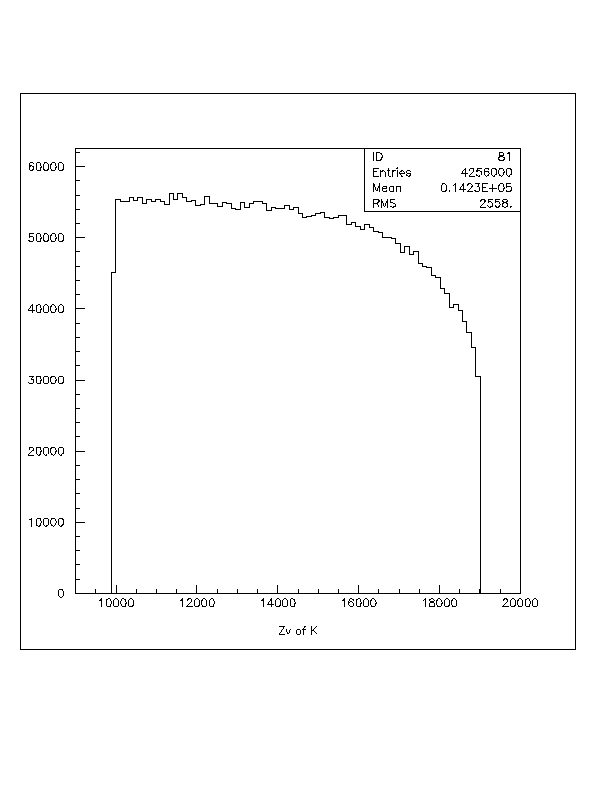
Now only some general plots...
just to see the Flyo production at work.
Please clik on the figure to enlarge!
--mouse middle button--
--mouse middle button--
|
pk as gen. |
Spots at Kbs1 |
Spot at Kbs3 |
z of vtx |
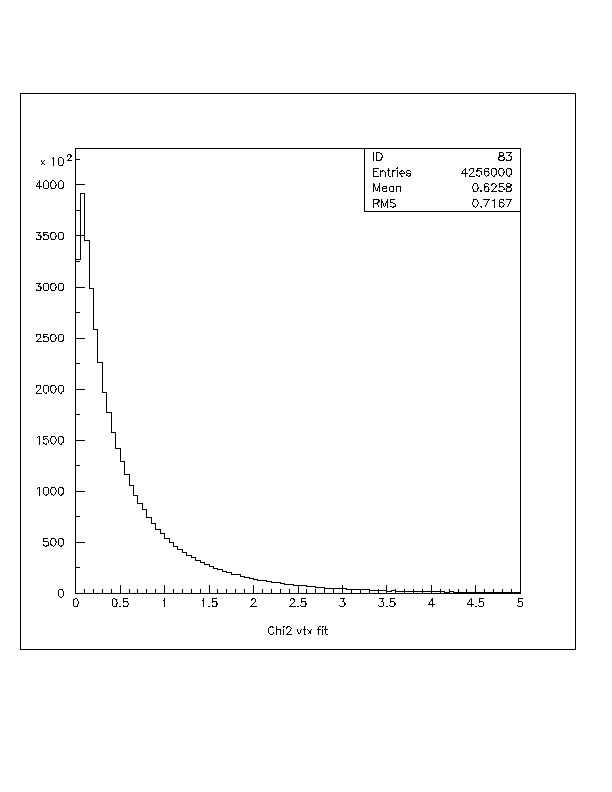
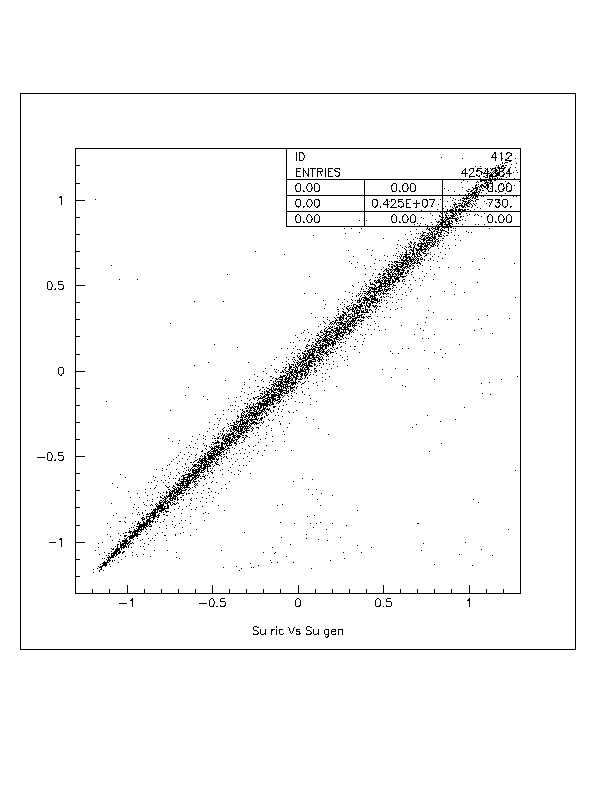
Resolution and chi2
|
Chi2 for vtx |
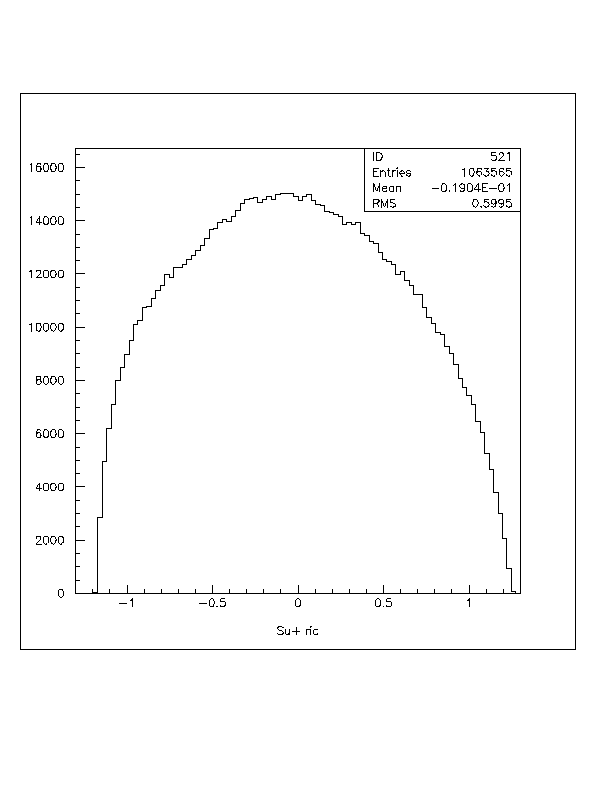
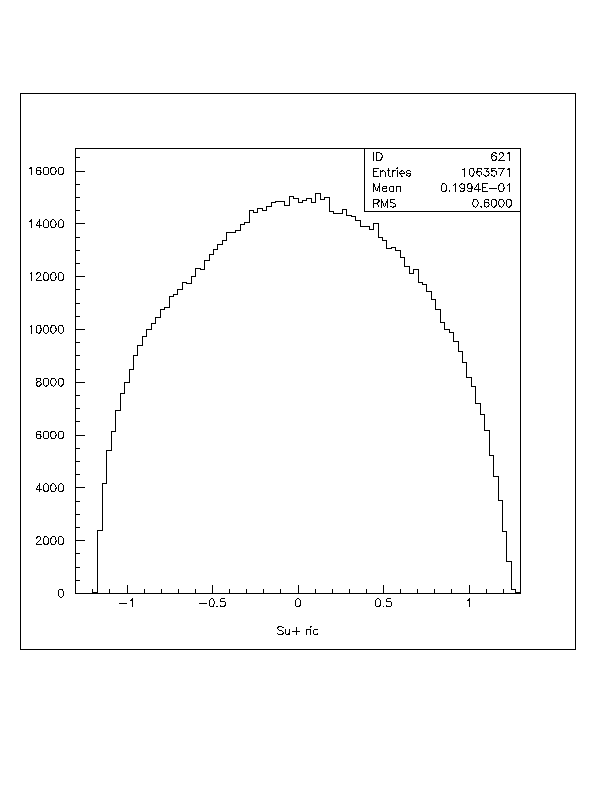
Su resolution |
Shift in x
Obviously the analysis of the "impertubated" categories yields an exact zero δg.
However a small perturbation changing the hit point coordinates in one chamber of the above perfectly correlated events, could produce a slope different from zero which can be easily interpreted because the correlation procedure described above is virtually statistical error free.
The following plots show the u-distribution as obtained after a 1 mm displacement of DCH2 along the x direction. The two samples with opposite magnetic field orientation are plotted separately (first two plots) and then merged (third plot).
u distributions for up and down field.
| Field up | Field down | <=> | Event merging |
u+ up
|
u+ dw
|
<=> | 
u+ all
|
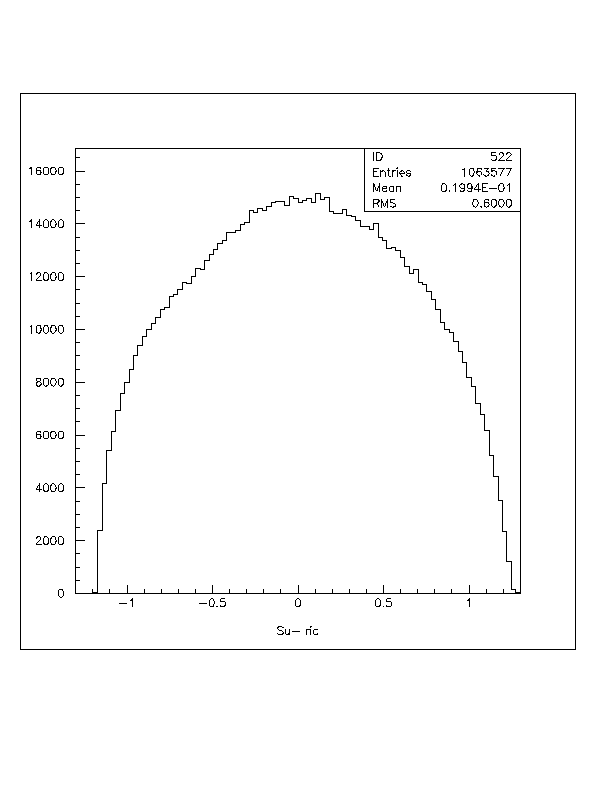
u- up
|

u- dw
|
<=> | 
u- all.png
|
The ratio between the u distributions could be done in two different ways.
First case:
Here each u+/u- distribution belongs to runs with the same magnetic field orientation:
| Field up ===> | 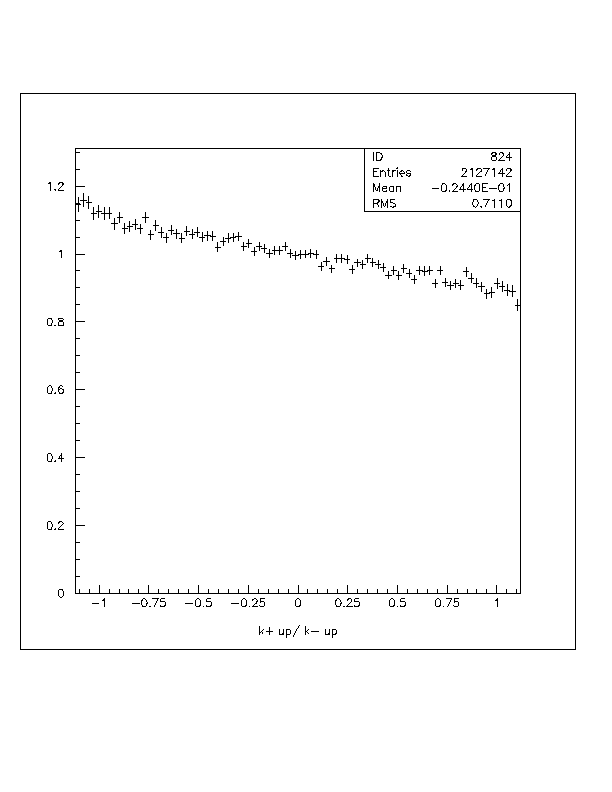
u+ up/u- up |
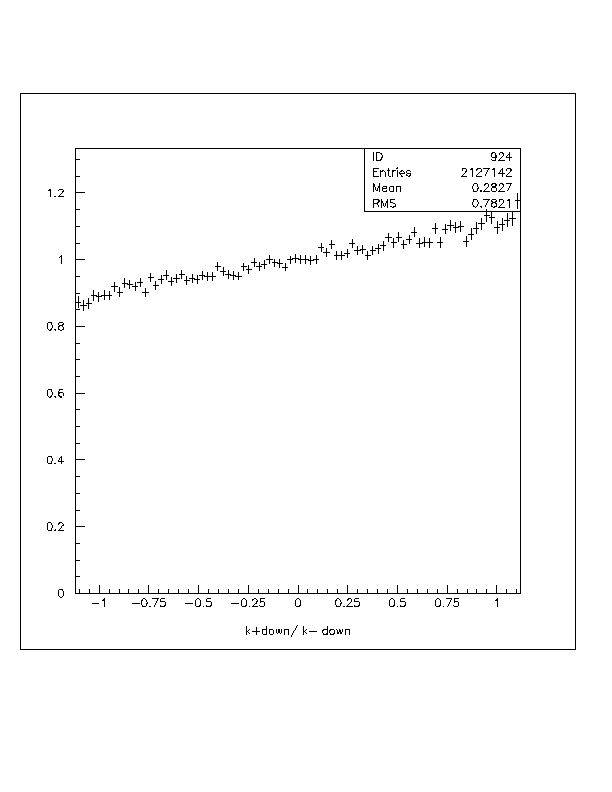
u+ dw/u- dw |
<==Field down |
This effect can be understood by taking into account that a shift in the x direction, modifies the apparent curvature of the pion track and therefore increases or decreases the pion momentum in a charge dependent fashion. Let's also note that the two samples entering in each plot are related by the CR180=CPxPy operator that reflect all the curvature orientation respect to a vertical plane.
Now the u value, which is computed from the odd pion energy in the center of mass, is affected by opposite distortion depending on the primary Kaon charge.
It has been also verified that a shift of -1.0 mm gives exactly the same effects on the slopes, but with the opposite signs. Moreover, reducing the shift to 0.5 mm it has been obtained (in a small run) a slope of δg=(0.05 ± 0.006), that demonstrates that the effect , at least in the first approximation, is linear with the shift.
|
The effect perfectly cancels out when the slope is extracted by averaging on the two magnetic field orientation |
Rap all |
Second case:
The other method is to couple the u+ and u- distribution with opposite (crossed) field signs
| u+ from up field runs over u- from down field runs....... |
u+ dw/u- up |
u+ up/u- dw |
u+ from down field runs over u- from up field runs....... |
First you get the two slopes by fitting the "crossed u+/u- distributions", then you compute the final slope just as a simple average.
Shift in y
A mc Flyo run has been devoted to evaluate the effect on the slope when a shift of one millimeter, on the chamber two, is applied in the vertical (y) direction.
The result, see the next picture, is different from the previous x case: the slope now stays zero, even if small fluctuations appear on the distribution, that could be explained as due to the acceptance effect, but they are equally distributed on the plot and do not spoil the final result.
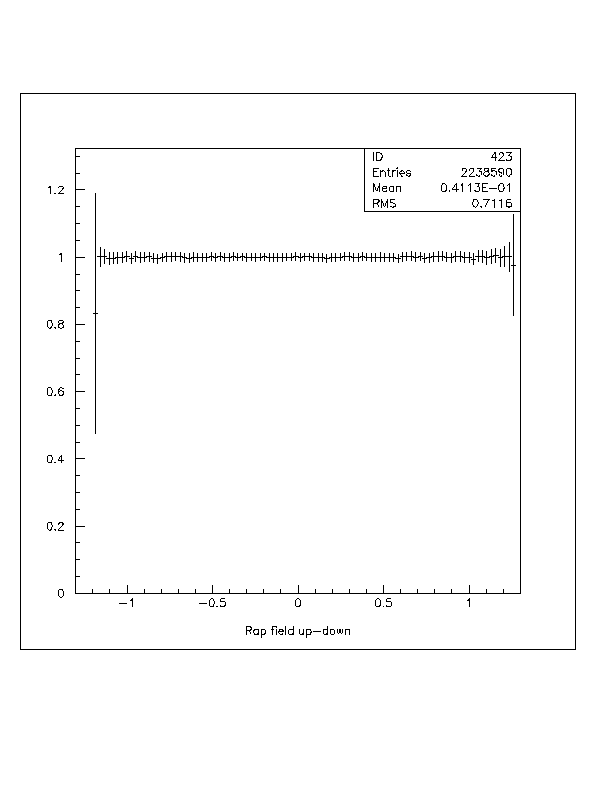
u+/u- with shift y
Pisa
10.03.04
GmP,SG
===================================
GmP,SG