K==> ΠoΠo Π resolution study
Number of images: 17
Created on: Monday 23 February 2004
The K==> ΠoΠo Π data simulated by Flyo have been reconstructed
with two methods:
The first method (M1) evaluates the z-decay vertex imposing on the gamma mass a value
equal to the missing mass of the K-Π system.
The second method (M2) reconstructs the z vertex as linear mean between the two
nearest z-values choosen out of the three couplings obtained by constraining the gamma pairs
to the neutral pion mass.
General pictures
Please clik on the figure to enlarge!
--mouse middle button--
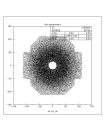
Calorimeter population
|
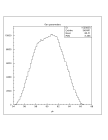
Momentum of K as generated
|
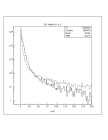
Chi2 for pion mass test
M1 (solid) and M2 (dash)
|
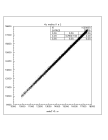
M2 Z vs Z-gen.
|
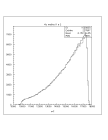
Riconstructed Z_vtx
for M1 and M2
|
Masses
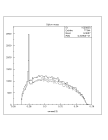
Πo Πo
gener. and recon. in M1 and M2
|
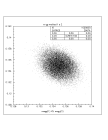
mγ12 vs mγ34
only M1
|
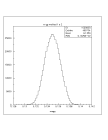
mγγ
only M1
|
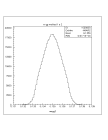
mγγ
only M2
|
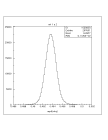
K mas
Only M1
|
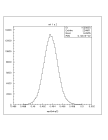
K mas
Only M2
|
Resolution plots
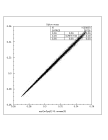
Πo Πo vs generated mass
|
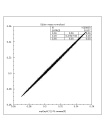
M1: Πo Πo vs generated mass
normalized to k mass
|
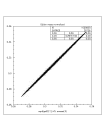
M2: Πo Πo vs generated mass
normalized to k mass
|
The last two scatter plots show that the two methods have similar behaviour on dipion mass
resolution when the dipion mass is correted by the K mass difference between the
reconstructed and the real one.
Results
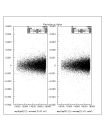
M(Πo Πo) vs zvtx
M1 and M2
|
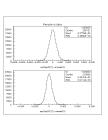
M(Πo Πo) resolution
|
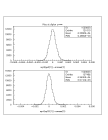
M(Πo Πo) resolution
at dipion mass (.27912)
|
The dipion mass resolution depends, for both methods (M1 and M2), on the dipion mass and on z decay
and it is getting worse at the end of the decay region.
The resolution integrated on all decay path (second plot) is around 700 KeV for both methods,
while it could be less then 500 Kev at the dipion mass, eventually choosing a shorter decay
region (less then 160 mt) as in the third plot. The method M1 seems to
be slightly better then the other, however the result depends on the applied cuts.
Pisa 5.03.04
GmP
================================


